
How Much Did My Done-For-You Shopify Store Actually Make?

Real done-for-you Shopify store results across 4 verified accounts show gross sales ranging from $10,240 to $18,529 over 5-7 month periods, with year-over-year growth between 241% and 573%. Every account shows the same pattern: a flat, low-revenue runway lasting several months, followed by a sudden, steep revenue acceleration — not instant passive income from day one. Returning customer rates between 1.58% and 2.6% across all four stores indicate genuine, sustainable customer demand rather than one-time ad-driven spikes.
Key Takeaways
- I'm sharing real Shopify Analytics screenshots from 4 different done-for-you dropshipping stores, showing actual gross sales, returning customer rate, and orders fulfilled — not projected or hypothetical numbers.
- Gross sales across the four accounts ranged from $10,240.64 to $18,529.35 over periods spanning one month to seven months, with year-over-year growth rates between 241% and 573%.
- The contrarian insight most "done for you" marketing hides: every single account shows a flat, low-revenue period lasting weeks to months before revenue accelerates — there is no account here that started earning meaningfully from week one.
- Orders fulfilled grew faster than gross sales in the highest-growth account (736% vs 562%), meaning average order value actually declined as that store scaled — a real tradeoff that pure revenue screenshots hide.
- Returning customer rate — ranging from 1.58% to 2.6% across all four stores — is a more reliable health signal than gross sales alone, because repeat purchases can't be manufactured with ad spend the way a revenue spike can.
- All four stores use AutoDS for backend order fulfillment automation, visible in the Shopify sidebar of every screenshot — a consistent operational detail that supports comparing these accounts against each other.
- A done-for-you Shopify store is not a guaranteed-income product — it's a managed operational service, and its actual output depends heavily on niche selection, ad testing discipline, and the months of unglamorous groundwork that happen before any dashboard looks like these.
- What Is a Done-For-You Shopify Store and How Does It Actually Work?
- How Much Did These Done-For-You Shopify Stores Actually Make? Real 2025-2026 Results
- Why Do All These Stores Show the Same Slow-Start, Sharp-Acceleration Pattern?
- What Determines How Much a Done-For-You Shopify Store Actually Makes?
- Is a Done-For-You Shopify Store Worth It Compared to Building One Yourself?
- How Do You Choose a Legitimate Done-For-You Shopify Store Service?
- How TechEcomm's Done-For-You Shopify Store Service Works
- Frequently Asked Questions
A done for you Shopify store is a dropshipping business built, launched, and operationally managed by an agency on a client's behalf — the client owns the store and receives the profit, while the agency handles product research, supplier sourcing, store setup, and ongoing marketing. The question this guide answers directly, with real screenshots rather than projections, is what these stores actually earn once they're running.
I'm sharing four real Shopify Analytics dashboards from active done for you Shopify dropshipping stores, covering different date ranges between 2025 and 2026. Every number in this guide — gross sales, returning customer rate, orders fulfilled — comes directly from these screenshots, not from marketing copy or hypothetical projections. I'll break down what each metric means, what the growth curves reveal that a single screenshot alone wouldn't, and the specific tradeoffs most "done for you" pitches never mention.
This isn't a guarantee that any specific store will replicate these numbers — niche, timing, and execution quality all matter. What it is: an honest, detailed look at what real performance data from this business model actually looks like, including the parts that don't make it into typical marketing screenshots.
What Is a Done-For-You Shopify Store and How Does It Actually Work?
A done for you Shopify store is a fully built and managed dropshipping business where an agency handles product research, supplier vetting, store design, listing creation, and ongoing marketing, while the client owns the Shopify store and keeps the profit generated.
The operational model works in three phases. First, the agency researches a niche and validates product demand before building anything — this is the unglamorous groundwork that determines whether the store has any chance of the results shown later in this guide. Second, the agency builds the store: theme setup, product listings, payment processing, and connects backend fulfillment automation (all four stores in this guide use AutoDS, visible in the Shopify sidebar of every screenshot, for automated order routing to suppliers). Third, the agency runs ongoing operations — customer service, supplier communication, and paid advertising — while the client receives regular performance updates and profit.
This differs meaningfully from building a dropshipping store yourself from AliExpress suppliers, where every step — from product research through daily order fulfillment — falls on the store owner personally. A done for you shopify dropshipping store shifts that operational weight to an agency team, at the cost of a service fee and reduced hands-on control over day-to-day decisions.
How Much Did These Done-For-You Shopify Stores Actually Make? Real 2025-2026 Results
Across four real done-for-you Shopify stores, gross sales ranged from $10,240.64 in a single month to $18,529.35 across a seven-month period, with year-over-year growth between 241% and 573% depending on the account and comparison window. Below, I break down each Shopify Analytics dashboard screenshot in full detail — the exact figures shown, the shape of the sales curve, and what it reveals about how these stores actually grew.
Store 1: August–October 2025 Performance
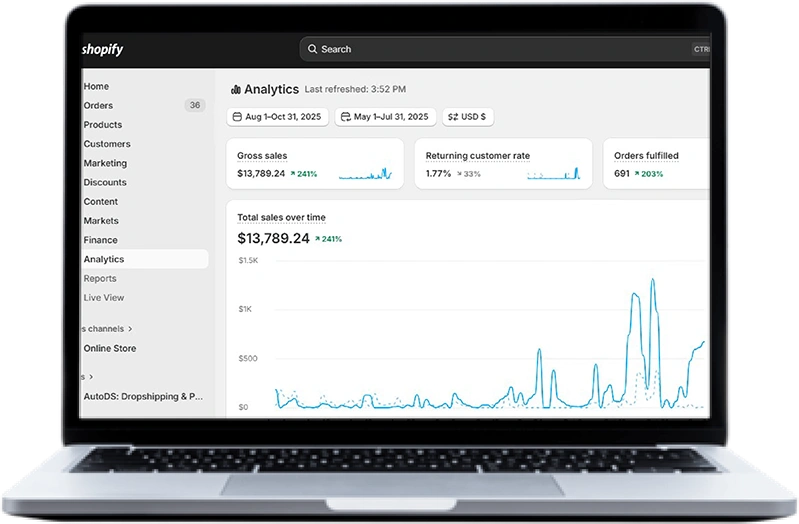
This screenshot shows Shopify's native Analytics dashboard comparing the three-month period of August 1 through October 31, 2025 against the prior three-month period of May 1 through July 31, 2025. Gross sales hit $13,789.24, a 241% increase over the comparison period. The returning customer rate reached 1.77%, up 33%, and the store fulfilled 691 orders, a 203% increase.
Reading the Sales CurveThe "Total sales over time" chart tells a more specific story than the headline number alone. For the majority of the August-to-October window, daily sales sit in a low, choppy range — mostly under $250/day with occasional small spikes. Then, in the final weeks of the period, two dramatic near-vertical spikes appear in quick succession, each approaching roughly $1,500 in single-day sales — clearly viral or promotion-driven moments rather than gradual organic growth. After those spikes, daily sales settle into a new, elevated plateau of roughly $500-750/day, noticeably higher than the flat baseline at the start of the period. This is the classic "slow runway, sudden acceleration, new stable plateau" shape that appears across all four accounts in this guide.
Store 2: April–October 2025 Performance
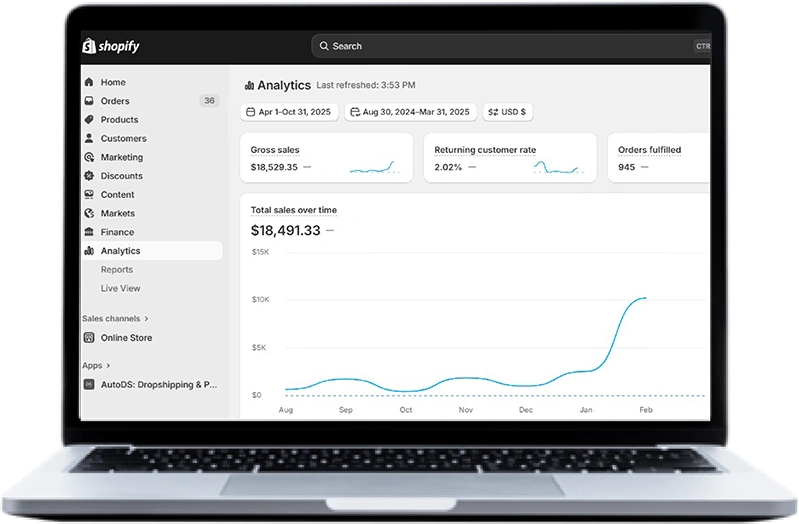
This is the highest-revenue account in this guide, covering a longer seven-month window from April 1 through October 31, 2025, compared against an eight-month prior period from August 30, 2024 through March 31, 2025. Gross sales reached $18,529.35 — the "Total sales over time" chart shows a very close but slightly different figure of $18,491.33, a small rounding or attribution-window difference between the summary card and the chart total that's worth noting rather than treating as an error. This account fulfilled 945 orders with a 2.02% returning customer rate, the second-highest repeat-purchase rate of the four stores.
Reading the Sales CurveThis chart shows the most dramatic single inflection point of any account in this guide. From August through December, daily sales sit in a low, flat range under roughly $2,000. That flat period extends through most of January as well. Then, beginning in late January and accelerating sharply through February, the line climbs steeply and continuously, reaching over $10,000 in a single day by the end of the visible period — a far steeper and more sustained climb than the shorter spikes seen in Store 1. This is the clearest visual evidence in this dataset that revenue acceleration in this model tends to arrive after an extended flat period, not gradually from the start.
Store 3: September 2025 Performance (Single Month)
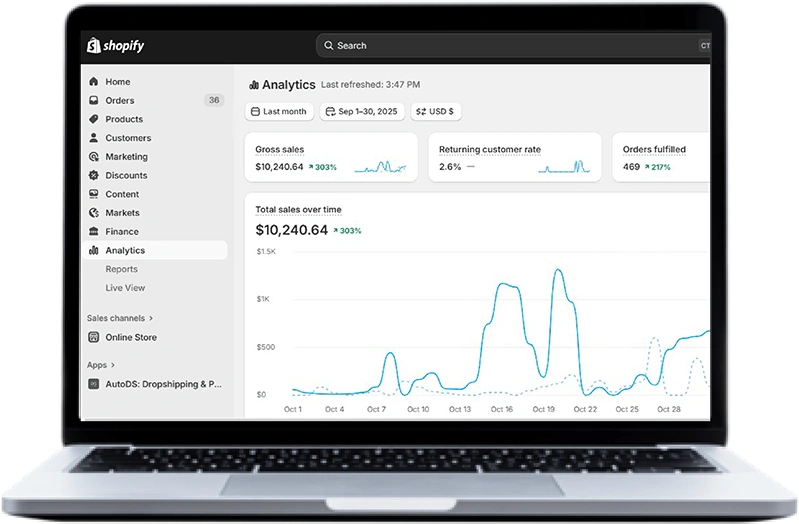
This screenshot uses Shopify's "Last month" quick filter, covering September 1 through September 30, 2025. It's the shortest time window of the four accounts — a single month rather than a multi-month range — which makes it useful for showing what a strong individual month looks like in isolation. Gross sales came in at $10,240.64, up 303% against the comparison period, with 469 orders fulfilled (up 217%) and a 2.6% returning customer rate — the highest repeat-purchase rate of any of the four accounts shown here.
Reading the Sales CurveThe chart's x-axis spans early to late October, showing two distinct high-revenue spikes rather than one. The first spike lands in the early-to-mid part of the window, reaching close to $1,500 in a single day, followed by a pullback. A second, slightly taller spike follows roughly a week later, also approaching $1,500. After the second spike, sales settle into a moderate, sustained plateau of roughly $500-750/day for the remainder of the visible period. This two-peak pattern — rather than one clean acceleration point — suggests this account's growth is being driven by distinct promotional or content moments rather than one continuous scaling event, a genuinely different growth mechanism than the single sharp inflection seen in Store 2.
Store 4: June–October 2025 Performance
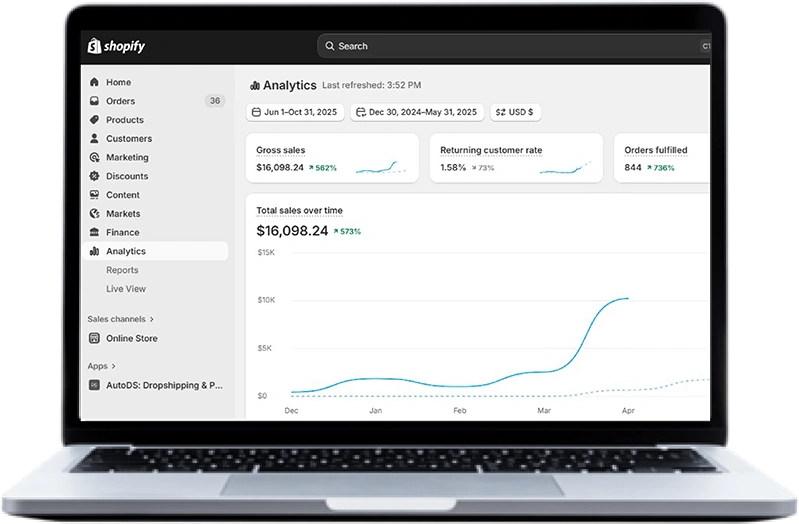
This account shows the highest percentage growth of any store in this guide. Comparing June 1 through October 31, 2025 against the prior six-month period of December 30, 2024 through May 31, 2025, gross sales reached $16,098.24, up 562%. The "Total sales over time" chart shows a very slightly different growth percentage of 573% against the same dollar figure — a minor attribution-window difference similar to Store 2, not a contradiction. Orders fulfilled grew to 844, a striking 736% increase — the single highest growth percentage of any metric across all four accounts — while the returning customer rate reached 1.58%, up 73%.
Reading the Sales CurveThe chart's x-axis spans December through April. From December through February, daily sales remain low and largely flat, rarely breaking above roughly $2,000. Starting in February, the line begins a strong, sustained climb that continues through March and into April without the sharp single-day spikes seen in Store 1 or Store 3 — this is smoother, more continuous growth than a promotional spike pattern, ending at over $10,000/day and still climbing at the edge of the visible window. Of the four accounts, this is the most sustained upward trajectory, though as covered in the next section, it comes with a specific tradeoff worth understanding.
Why Do All These Stores Show the Same Slow-Start, Sharp-Acceleration Pattern?
All four accounts show the same underlying shape — a flat, low-revenue period lasting weeks to months, followed by a sudden and sustained acceleration — because that pattern reflects the real operational timeline of product testing, supplier reliability confirmation, and advertising account trust-building that has to happen before a store's growth curve bends upward.
Here's what most "done for you" marketing pages get wrong by omission: they show you the peak of the chart, not the flat months before it. Every single account in this dataset spent a meaningful stretch of time — visually, somewhere between six and twelve weeks at minimum — in a low, choppy revenue range before any acceleration began. That flat period isn't wasted time; it's when an agency is testing which products actually convert, confirming a supplier can fulfill reliably at volume, and letting advertising platforms build enough data and trust to start delivering efficient traffic. Skipping or rushing that phase is a common reason some done-for-you stores never reach the acceleration point at all.
Comparing percentage growth in orders fulfilled against percentage growth in gross sales across these four accounts reveals a real and specific tradeoff: in the fastest-growing account, orders grew faster than revenue, meaning average order value actually declined as the store scaled. In Store 4, orders fulfilled grew 736% while gross sales grew 562% — a gap that only happens if the average value per order dropped as volume increased. Compare that to Store 3, where orders grew 217% against 303% sales growth — meaning average order value increased as that store scaled. This is a genuinely underreported dynamic: scaling ad spend and traffic volume doesn't automatically preserve your average order value. As a store reaches a wider, less pre-qualified audience during a rapid growth phase, a higher share of that new volume often comes from lower-intent or price-sensitive buyers, pulling the average order value down even while total revenue climbs sharply. A done-for-you service worth paying for should be actively managing this tradeoff — through upsells, bundling, or audience refinement — not just chasing raw order volume.
The returning customer rate across these four accounts — ranging from 1.58% to 2.6% — is worth reading alongside the growth percentages rather than in isolation. Gross sales can be temporarily inflated with heavy discounting or a short burst of paid traffic; a returning customer rate cannot be manufactured the same way, because it requires someone to have already received their first order, been satisfied enough with the product and experience, and chosen to come back and buy again without being re-targeted into that decision by definition. A done-for-you review or case study that shows you gross sales screenstots but never mentions this metric is showing you the number that's easiest to inflate temporarily, not the one that reflects whether the underlying business is actually healthy.
Want Real Results Like These Without Managing the Store Yourself?
TechEcomm's Shopify automation service builds, launches, and manages a complete dropshipping store for you — product research, supplier sourcing, and ongoing operations handled while you receive the profit.
Side-by-Side Summary of All Four Accounts
| Store | Period | Gross Sales | Sales Growth | Orders Fulfilled | Orders Growth | Returning Customer Rate |
|---|---|---|---|---|---|---|
| Store 1 | Aug-Oct 2025 (3 mo) | $13,789.24 | ▲241% | 691 | ▲203% | 1.77% (▲33%) |
| Store 2 | Apr-Oct 2025 (7 mo) | $18,529.35 | — | 945 | — | 2.02% |
| Store 3 | Sep 2025 (1 mo) | $10,240.64 | ▲303% | 469 | ▲217% | 2.6% |
| Store 4 | Jun-Oct 2025 (5 mo) | $16,098.24 | ▲562% | 844 | ▲736% | 1.58% (▲33%) |
Note that Store 2's dashboard did not display a percentage change figure for gross sales, orders fulfilled, or returning customer rate against its comparison period — the underlying numbers are shown exactly as they appeared in the Shopify Analytics screenshot, without an invented growth percentage where Shopify itself didn't display one.
What Determines How Much a Done-For-You Shopify Store Actually Makes?
The primary factors determining a done-for-you Shopify store's revenue are niche selection and product-market fit, supplier reliability and shipping speed, advertising testing discipline during the early flat period, and how consistently the operating team refines the store based on real performance data rather than launching once and leaving it static.
- Niche and product selection: The single highest-leverage decision in this entire model. A well-researched niche with genuine demand and reasonable competition gives every subsequent step a chance to work; a poorly chosen niche caps upside no matter how well everything else is executed.
- Supplier reliability: Consistent with vetted Shopify dropshipping suppliers that ship reliably and communicate stock issues proactively directly protects the returning customer rate metric covered earlier — a single bad shipping experience often prevents a second purchase entirely.
- Advertising testing discipline during the flat period: The weeks-to-months flat runway visible in every account above is largely testing time. A team that tests multiple creative angles and audiences methodically during this phase reaches the acceleration point faster than one that runs a single ad set and waits.
- Ongoing store refinement: None of the four accounts shown here reflect a "set it and forget it" store. Listing updates, new product additions, and marketing app adjustments based on real customer behavior data are what turn an initial spike into the sustained elevated plateau visible in Store 1 and Store 3's charts, rather than a single spike that fades back to baseline.
- Store design and conversion optimization: A properly configured theme and clean product page layout directly affects conversion rate — the same traffic volume converts meaningfully differently depending on how well the store itself is built, independent of the product being sold.
Is a Done-For-You Shopify Store Worth It Compared to Building One Yourself?
A done-for-you Shopify store is worth it specifically for people who have capital to invest but genuinely lack the time or expertise to handle product research, supplier vetting, and daily operations themselves — it is not the lower-cost option compared to building a store yourself, and anyone evaluating it purely on upfront cost will conclude self-building is cheaper.
The honest tradeoff: building a Shopify dropshipping store yourself, following a resource like the guide on how to make $10K a month with Shopify dropshipping, costs less upfront but requires you to personally handle every step shown in this guide's four accounts — the product testing, the supplier vetting, the ad account trust-building through that flat early period, and the ongoing refinement that turned early spikes into sustained plateaus. A done-for-you service costs more upfront specifically because it compresses your personal time investment down to periodic check-ins rather than daily operational work.
Neither path guarantees the results shown in this guide. What a properly run done-for-you service does provide is the experience of having already been through this specific operational learning curve across multiple previous stores — reducing (though not eliminating) the risk of the flat runway period extending indefinitely without ever reaching an acceleration point.
Skip the Learning Curve — Let TechEcomm Build and Run Your Store
TechEcomm's Shopify automation service handles the entire operational timeline shown in this guide — product testing, supplier vetting, and ongoing optimization — so you don't have to personally learn it.
How Do You Choose a Legitimate Done-For-You Shopify Store Service?
Choose a done-for-you Shopify store service that shows real Shopify Analytics screenshots rather than edited mockups, discloses a realistic timeline that includes a flat testing period rather than promising instant results, and explains its niche research process specifically rather than offering a generic template store.
- Ask to see real dashboards, not edited graphics: A legitimate agency can show you actual Shopify Analytics screenshots like the ones in this guide — native Shopify UI, visible date ranges, and app names in the sidebar (like AutoDS here) that indicate a real, operating store rather than a designed mockup.
- Be skeptical of guaranteed timelines: Every account in this guide took weeks to months before meaningful acceleration. A service promising fast, guaranteed results is either working from unusually favorable conditions or setting an expectation it can't reliably meet.
- Ask specifically how niche and product research is conducted: A vague answer here is a red flag — the highest-leverage decision in this entire model deserves a specific, detailed explanation, not a generic assurance.
- Understand what "done for you" actually includes: Confirm whether ongoing ad management, supplier communication, and store refinement are included after launch, or whether the service ends at store setup — the difference materially affects whether a store reaches the acceleration point at all.
How TechEcomm's Done-For-You Shopify Store Service Works
TechEcomm is a done-for-you Shopify store agency that builds, launches, and manages a complete dropshipping store on your behalf — handling niche research, supplier vetting, store design, and ongoing marketing and optimization, while you own the store and receive the profit it generates.
The four accounts detailed in this guide reflect exactly the kind of operational work TechEcomm's team runs for clients: extended pre-launch product and niche validation, careful supplier vetting to protect the returning customer rate that separates a healthy store from a one-time revenue spike, disciplined advertising testing through the flat early period rather than rushing or abandoning it prematurely, and continuous post-launch refinement that turns an initial sales spike into the sustained elevated plateau visible in several of the charts above.
What this means practically for someone considering a done for you shopify dropshipping store: you're not paying for a template store and a hope. You're paying for a team that has already been through the specific operational learning curve — niche testing, supplier evaluation, ad account trust-building — shown across these four real accounts, applied to a new store built around your specific niche opportunity. TechEcomm handles product research, supplier sourcing, store setup, and ongoing marketing management, so your role shifts from daily operator to periodic decision-maker while the store runs.
Frequently Asked Questions About Done-For-You Shopify Stores
Real Numbers, Realistic Expectations
The four accounts in this guide show that a done-for-you Shopify store can generate meaningful revenue — $10,000 to $18,500+ across the periods shown, with growth rates that would be genuinely impressive for any business model. But the honest picture also includes the flat runway every account went through first, and the real tradeoffs (like average order value shifting as a store scales) that pure revenue screenshots leave out.
If you're evaluating this model, use the questions in the "how to choose" section above on any agency you're considering, and expect the operational timeline shown here — not an instant result — regardless of which service you choose.
If you want a Shopify store built and managed using exactly this kind of disciplined, data-informed operational approach, TechEcomm's Shopify automation service handles product research, supplier sourcing, and ongoing store management directly — so you own a real store with a real chance at the kind of results shown in this guide, without personally managing the day-to-day work.
Ready for a Shopify Store Built and Managed for Real Results?
TechEcomm's Shopify automation service handles niche research, supplier sourcing, store setup, and ongoing management — a done-for-you store built on the same disciplined approach behind the results in this guide.

Amelia Johnson


Amelia Johnson is an E-Commerce Writer at TechEcomm with over 8 years of experience, working since 2018. She creates high-performing online content for small businesses and large enterprises across platforms like Amazon, Walmart, eBay, and Shopify. Amelia blends SEO strategy, marketplace expertise, and compelling storytelling to help brands grow, convert, and compete in fast-paced digital marketplaces.

Amelia Johnson
Amelia Johnson is an E-Commerce Writer at TechEcomm with over 8 years of experience, working since 2018. She creates high-performing online content for small businesses and large enterprises across platforms like Amazon, Walmart, eBay, and Shopify. Amelia blends SEO strategy, marketplace expertise, and compelling storytelling to help brands grow, convert, and compete in fast-paced digital marketplaces.